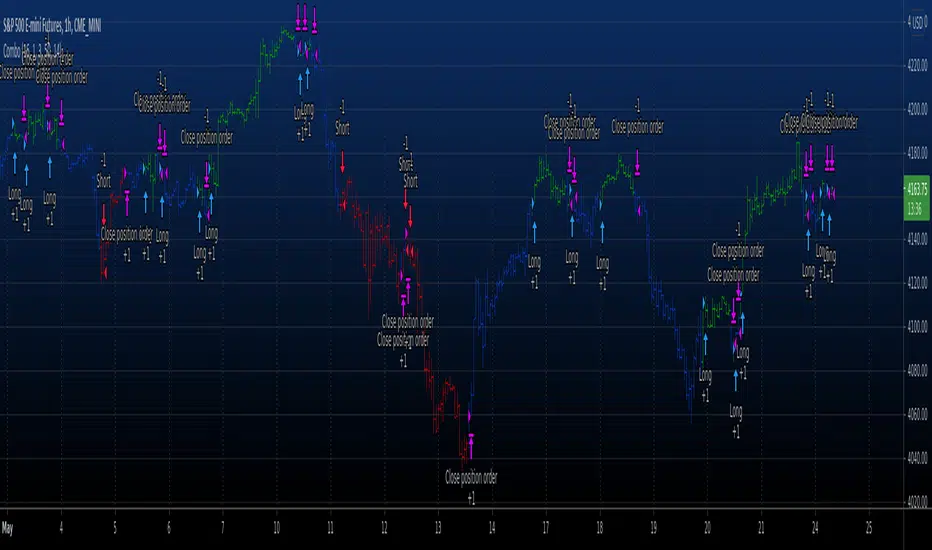
Combo Backtest 123 Reversal & Awesome Oscillator (AO) This is combo strategies for get a cumulative signal.
First strategy
This System was created from the Book "How I Tripled My Money In The
Futures Market" by Ulf Jensen, Page 183. This is reverse type of strategies.
The strategy buys at market, if close price is higher than the previous close
during 2 days and the meaning of 9-days Stochastic Slow Oscillator is lower than 50.
The strategy sells at market, if close price is lower than the previous close price
during 2 days and the meaning of 9-days Stochastic Fast Oscillator is higher than 50.
Second strategy
This indicator is based on Bill Williams` recommendations from his book
"New Trading Dimensions". We recommend this book to you as most useful reading.
The wisdom, technical expertise, and skillful teaching style of Williams make
it a truly revolutionary-level source. A must-have new book for stock and
commodity traders.
The 1st 2 chapters are somewhat of ramble where the author describes the
"metaphysics" of trading. Still some good ideas are offered. The book references
chaos theory, and leaves it up to the reader to believe whether "supercomputers"
were used in formulating the various trading methods (the author wants to come across
as an applied mathemetician, but he sure looks like a stock trader). There isn't any
obvious connection with Chaos Theory - despite of the weak link between the title and
content, the trading methodologies do work. Most readers think the author's systems to
be a perfect filter and trigger for a short term trading system. He states a goal of
10%/month, but when these filters & axioms are correctly combined with a good momentum
system, much more is a probable result.
There's better written & more informative books out there for less money, but this author
does have the "Holy Grail" of stock trading. A set of filters, axioms, and methods which are
the "missing link" for any trading system which is based upon conventional indicators.
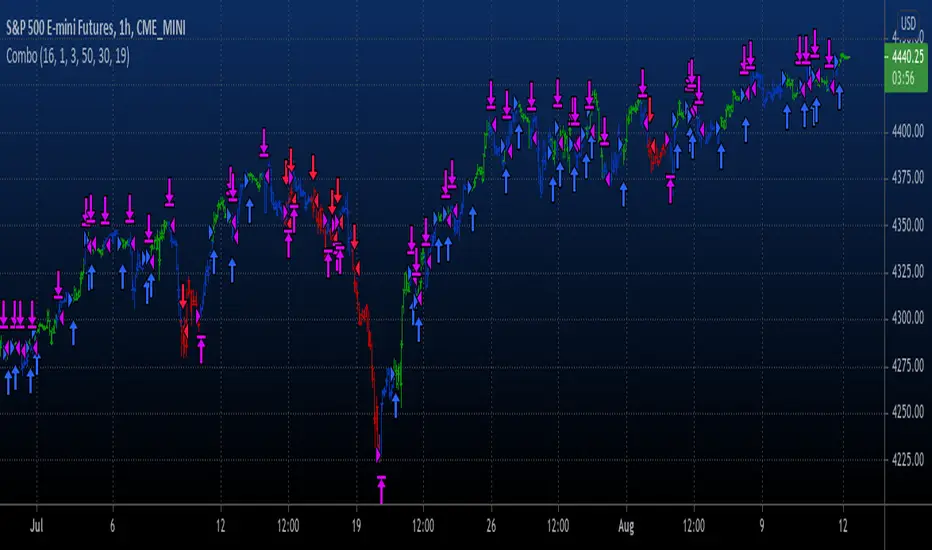
This indicator plots the oscillator as a histogram where periods fit for buying are marked
as blue, and periods fit for selling as red. If the current value of AC (Awesome Oscillator)
is over the previous, the period is deemed fit for buying and the indicator is marked blue.
If the AC values is not over the previous, the period is deemed fir for selling and the indicator
is marked red.
WARNING:
- For purpose educate only
- This script to change bars colors.
Cari dalam skrip untuk "the strat"
Combo Backtest 123 Reversal & Awesome Oscillator (AC) This is combo strategies for get a cumulative signal.
First strategy
This System was created from the Book "How I Tripled My Money In The
Futures Market" by Ulf Jensen, Page 183. This is reverse type of strategies.
The strategy buys at market, if close price is higher than the previous close
during 2 days and the meaning of 9-days Stochastic Slow Oscillator is lower than 50.
The strategy sells at market, if close price is lower than the previous close price
during 2 days and the meaning of 9-days Stochastic Fast Oscillator is higher than 50.
Second strategy
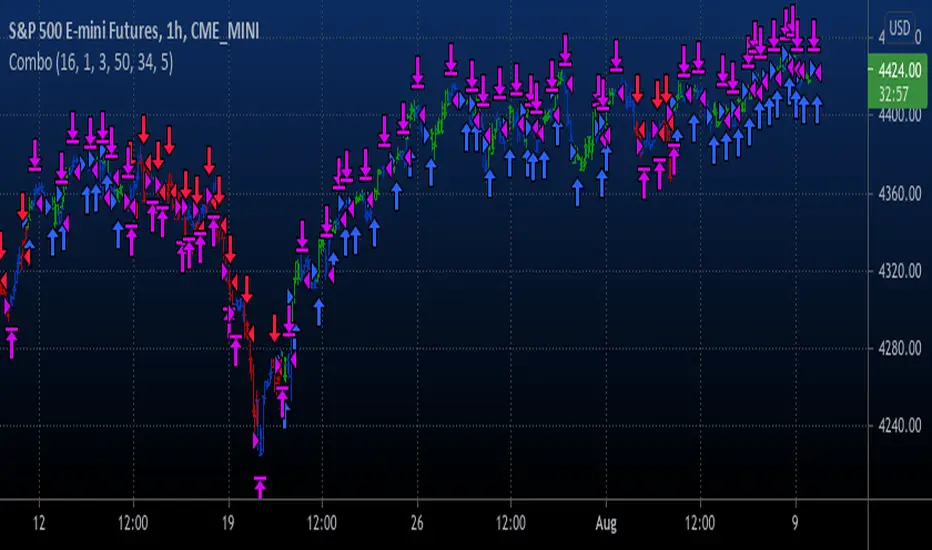
This indicator plots the oscillator as a histogram where blue denotes
periods suited for buying and red . for selling. If the current value
of AO (Awesome Oscillator) is above previous, the period is considered
suited for buying and the period is marked blue. If the AO value is not
above previous, the period is considered suited for selling and the
indicator marks it as red.
WARNING:
- For purpose educate only
- This script to change bars colors.
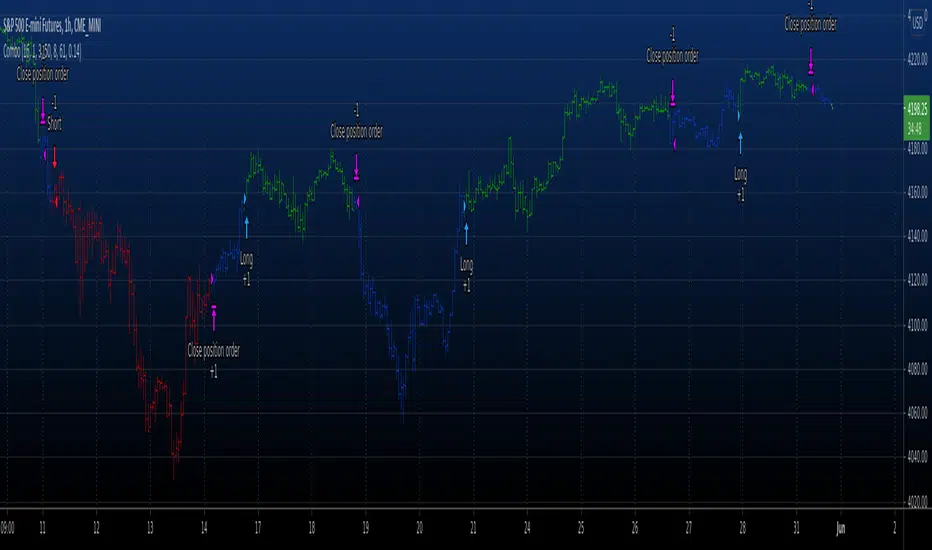
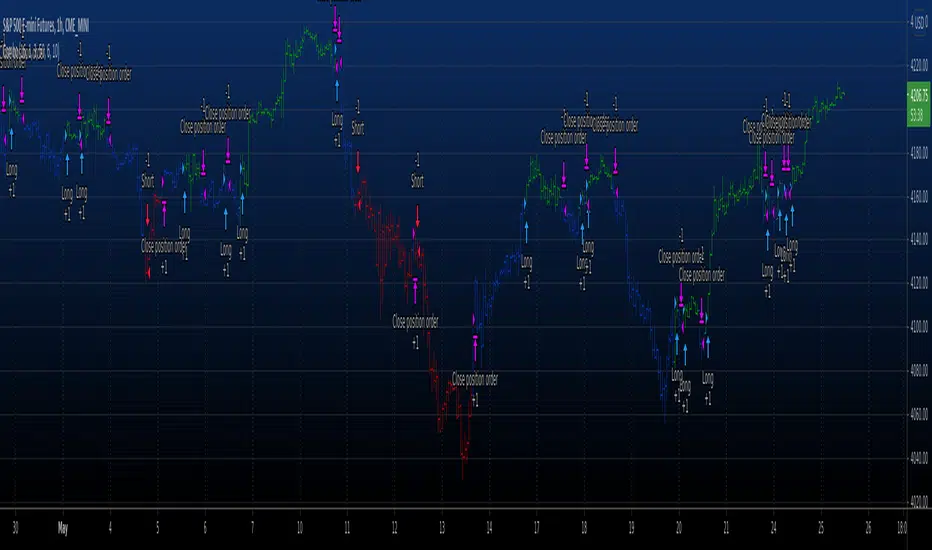
Random Entries Work!" tHe MaRkEtS aRe RaNdOm ", say moron academics.
The purpose of this study is to show that most markets are NOT random! Most markets show a clear bias where we can make such easy money, that a random number generator can do it.
=== HOW THE INDICATOR WORKS ===
The study will randomly enter the market
The study will randomly exit the market if in a trade
You can choose a Long Only, Short Only, or Bidirectional strategy
=== DEFAULT VALUES AND THEIR LOGIC ===
Percent Chance to Enter Per Bar: 10%
Percent Chance to Exit Per Bar: 3%
Direction: Long Only
Commission: 0
Each bar has a 10% chance to enter the market. Each bar has a 3% to exit the market . It will only enter long.
I included zero commission for simplification. It's a good exercise to include a commission/slippage to see just how much trading fees take from you.
=== TIPS ===
Increasing "Percent Chance to Exit" will shorten the time in a trade. You can see the "Avg # Bars In Trade" go down as you increase. If "Percent Chance to Exit" is too high, the study won't be in the market long enough to catch any movement, possibly exiting on the same bar most of the time.
If you're getting the red screen, that means the strategy lost so much money it went broke. Try reducing the percent equity on the Properties tab.
Switch the start year to avoid/minimize black swan events like the covid drop in 2020.
=== FINDINGS ===
Most markets lose money with a "Random" direction strategy.
Most markets lose ALL money with a "Short Only" strategy.
Most markets make money with a "Long Only" strategy.
Try this strategy on: Bitcoin (BTCUSD) and the NASDAQ (QQQ).
There are two popular memes right now: "Bitcoin to the moon" and "Stocks only go up". Both are seemingly true. Bitcoin was the best performing asset of the 2010's, gaining several billion percent in gains. The stock market is on a 100 year long uptrend. Why? BECAUSE FIAT CURRENCIES ALWAYS GO DOWN! This is inflation. If we measure the market in terms of others assets instead of fiat, the Long Only strategy doesn't work anymore (or works less well).
Try this strategy on: Bitcoin/GLD (BTCUSD/GLD), the Eurodollar (EURUSD), and the S&P 500 measured in gold (SPY/GLD).
Bitcoin measured in gold (BTCUSD/GLD) still works with a Long Only strategy because Bitcoin increased in value over both USD and gold.
The Eurodollar (EURUSD) generally loses money no matter what, especially if you add any commission. This makes sense as they are both fiat currencies with similar inflation schedules.
Gold and the S&P 500 have gained roughly the same amount since ~2000. Some years will show better results for a long strategy, while others will favor a short strategy. Now look at just SPY or GLD (which are both measured in USD by default!) and you'll see the same trend again: a Long Only strategy crushes even when entering and exiting randomly.
=== " JUST TELL ME WHAT TO DO, YOU NERD! " ===
Bulls always win and Bears always lose because fiat currencies go to zero.
You're not underperforming a random number generator, are you?

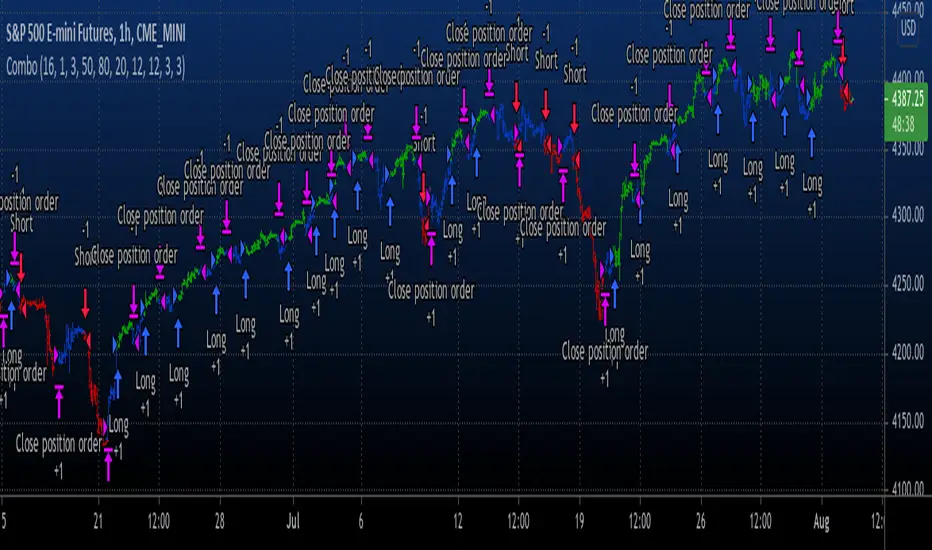
Combo Backtest 123 Reversal & 2/20 Exponential MA This is combo strategies for get a cumulative signal.
First strategy
This System was created from the Book "How I Tripled My Money In The
Futures Market" by Ulf Jensen, Page 183. This is reverse type of strategies.
The strategy buys at market, if close price is higher than the previous close
during 2 days and the meaning of 9-days Stochastic Slow Oscillator is lower than 50.
The strategy sells at market, if close price is lower than the previous close price
during 2 days and the meaning of 9-days Stochastic Fast Oscillator is higher than 50.
Second strategy
This indicator plots 2/20 exponential moving average. For the Mov
Avg X 2/20 Indicator, the EMA bar will be painted when the Alert criteria is met.
WARNING:
- For purpose educate only
- This script to change bars colors.

Combo Backtest 123 Reversal & Stochastic RSIThis is combo strategies for get a cumulative signal.
First strategy
This System was created from the Book "How I Tripled My Money In The
Futures Market" by Ulf Jensen, Page 183. This is reverse type of strategies.
The strategy buys at market, if close price is higher than the previous close
during 2 days and the meaning of 9-days Stochastic Slow Oscillator is lower than 50.
The strategy sells at market, if close price is lower than the previous close price
during 2 days and the meaning of 9-days Stochastic Fast Oscillator is higher than 50.
Second strategy
This strategy used to calculate the Stochastic RSI
WARNING:
- For purpose educate only
- This script to change bars colors.
Combo Backtest 123 Reversal & Statistical Volatility This is combo strategies for get a cumulative signal.
First strategy
This System was created from the Book "How I Tripled My Money In The
Futures Market" by Ulf Jensen, Page 183. This is reverse type of strategies.
The strategy buys at market, if close price is higher than the previous close
during 2 days and the meaning of 9-days Stochastic Slow Oscillator is lower than 50.
The strategy sells at market, if close price is lower than the previous close price
during 2 days and the meaning of 9-days Stochastic Fast Oscillator is higher than 50.
Second strategy
This indicator used to calculate the statistical volatility, sometime
called historical volatility, based on the Extreme Value Method.
Please use this link to get more information about Volatility.
WARNING:
- For purpose educate only
- This script to change bars colors.

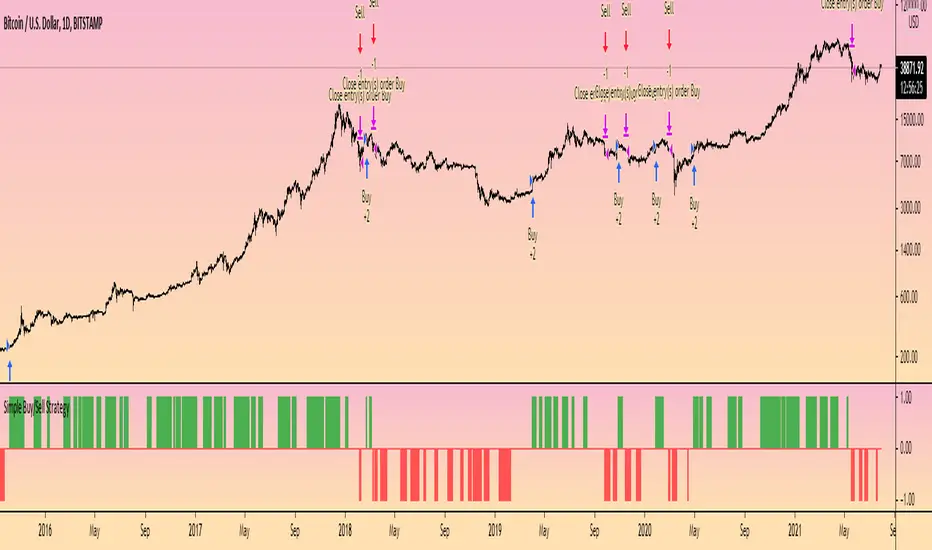
Simple Buy/Sell StrategyThis is the strategy version of the original 'Simple Buy/Sell Indicator' by @Shizaru .
The original indicator description explains the logic behind the strategy:
"The original script was posted on ProRealCode by user Doctrading.
This little and simple code allows you to draw an indicator, which show you when buy or sell conditions are met.
For "buy" conditions, I did just set :
close > MM200
close > Parabolic SAR
MACD > 0
RSI7 > 50
For "sell" conditions : the opposite.
Of course, you can set what you want, in order to test your strategies.
Of course, to be profitable, you must also set your trading rules (entry, stop loss, trailing stop, take profit, etc.)
It's only an indicator, which doesn't show entry or exit rules."
Hope this helps someone!
Combo Backtest 123 Reversal & STARC BandsThis is combo strategies for get a cumulative signal.
First strategy
This System was created from the Book "How I Tripled My Money In The
Futures Market" by Ulf Jensen, Page 183. This is reverse type of strategies.
The strategy buys at market, if close price is higher than the previous close
during 2 days and the meaning of 9-days Stochastic Slow Oscillator is lower than 50.
The strategy sells at market, if close price is lower than the previous close price
during 2 days and the meaning of 9-days Stochastic Fast Oscillator is higher than 50.
Second strategy
A type of technical indicator that is created by plotting two bands around
a short-term simple moving average (SMA) of an underlying asset's price.
The upper band is created by adding a value of the average true range
(ATR) - a popular indicator used by technical traders - to the moving average.
The lower band is created by subtracting a value of the ATR from the SMA.
STARC is an acronym for Stoller Average Range Channels. The indicator is
named after its creator, Manning Stoller.
WARNING:
- For purpose educate only
- This script to change bars colors.

FTB Strategy (Automated)Hey traders!
This is a profitable strategy script I created to teach my students how to automate their scripts using 3rd party APIs (more info available in my profile link at the bottom of this page).
What Is This?
This strategy is called the "Follow The Bear" strategy.
It's a forex trading strategy designed for one purpose and one purpose only: to take advantage of a recurring pattern on EURUSD's 1-Hour chart during the European market open.
The basic explanation is this:
During the European open we want to see a rally followed by a swing high shooting star / reversal pinbar candle. This typically means that traders buying EURUSD during the European/London open are now trapped long, and as price begins to retrace they are forced to sell, fueling a short-term retracement.
This strategy takes advantage of that pattern by aggressively selling short with a tight stop-loss above the pinbar candle and a conservative target.
There are many ways to trade this pattern, but this script represents my personal method for trading it.
It is not 100% accurate (no strategy is), but it does have a considerably high win rate over the past 6+ years considering its simplicity and I've been trading it for several months and can attest to its edge over the markets (at least through the Oanda data feed which is what I use).
The strategy rules are this:
Market: EURUSD
Timeframe: 1-Hour
Direction: Short Only
Timezone: 6AM-10AM GMT
Days: Tuesday, Wednesday, Thursday
Entry: Close of Pinbar Setup
Stop: 2 pips above signal candle
Target: 1:1
Risk: Up to you (backtest first! I use 1%)
The rule for the pinbar/shooting star candle pattern is that the candle must both open and close in the lower 50% of the bar's total size.
Automation
This script is already prepared to be auto-traded through a 3rd-party API that was created to relay TradingView alerts to your broker to execute and manage trades.
Sorry for the lack of information - due to TradingView's house rules I cannot go into any more detail here, but if you're interested in automating this script there is more info available in the resources offered under my profile link at the bottom of this page.
Disclaimer
The material and the resources offered here are for educational purposes only. Always do your own research and only execute trades based on your own personal judgement.
Trading foreign currencies can be a challenging and potentially profitable opportunity for investors. However, before deciding to participate in the forex market, you should carefully consider your investment objectives, level of experience, and risk appetite. Most importantly, do not invest money you cannot afford to lose.
There is considerable exposure to risk in any foreign exchange transaction. Any transaction involving currencies involves risks including, but not limited to, the potential for changing political and/or economic conditions that may substantially affect the price or liquidity of a currency, investments in foreign exchange speculation may also be susceptible to sharp rises and falls as the relevant market values fluctuate.
The leveraged nature of forex trading means that any market movement will have an equally proportional effect on your deposited funds. This may work against you as well as for you. Not only may investors get back less than they invested, but in the case of higher risk strategies, investors may lose the entirety of their investment. It is for this reason that when speculating in such markets it is advisable to use only risk capital.
Trading foreign exchange on margin carries a high level of risk, and may not be suitable for all investors. Past performance is not indicative of future results. The possibility exists that you could sustain a loss of some or all of your initial investment and therefore you should not invest money that you cannot afford to lose. You should be aware of all the risks associated with foreign exchange trading, and seek advice from an independent financial advisor if you have any doubts.

Combo Backtest 123 Reversal & Smoothed Williams ADThis is combo strategies for get a cumulative signal.
First strategy
This System was created from the Book "How I Tripled My Money In The
Futures Market" by Ulf Jensen, Page 183. This is reverse type of strategies.
The strategy buys at market, if close price is higher than the previous close
during 2 days and the meaning of 9-days Stochastic Slow Oscillator is lower than 50.
The strategy sells at market, if close price is lower than the previous close price
during 2 days and the meaning of 9-days Stochastic Fast Oscillator is higher than 50.
Second strategy
Accumulation is a term used to describe a market controlled by buyers;
whereas distribution is defined by a market controlled by sellers.
Williams recommends trading this indicator based on divergences:
Distribution of the security is indicated when the security is making
a new high and the A/D indicator is failing to make a new high. Sell.
Accumulation of the security is indicated when the security is making
a new low and the A/D indicator is failing to make a new low. Buy.
WARNING:
- For purpose educate only
- This script to change bars colors.

Combo Backtest 123 Reversal & Smoothed RSIThis is combo strategies for get a cumulative signal.
First strategy
This System was created from the Book "How I Tripled My Money In The
Futures Market" by Ulf Jensen, Page 183. This is reverse type of strategies.
The strategy buys at market, if close price is higher than the previous close
during 2 days and the meaning of 9-days Stochastic Slow Oscillator is lower than 50.
The strategy sells at market, if close price is lower than the previous close price
during 2 days and the meaning of 9-days Stochastic Fast Oscillator is higher than 50.
Second strategy
This is new version of RSI oscillator indicator, developed by John Ehlers.
The main advantage of his way of enhancing the RSI indicator is smoothing
with minimum of lag penalty.
WARNING:
- For purpose educate only
- This script to change bars colors.
Combo Backtest 123 Reversal & SMI Ergodic Oscillator This is combo strategies for get a cumulative signal.
First strategy
This System was created from the Book "How I Tripled My Money In The
Futures Market" by Ulf Jensen, Page 183. This is reverse type of strategies.
The strategy buys at market, if close price is higher than the previous close
during 2 days and the meaning of 9-days Stochastic Slow Oscillator is lower than 50.
The strategy sells at market, if close price is lower than the previous close price
during 2 days and the meaning of 9-days Stochastic Fast Oscillator is higher than 50.
Second strategy
The SMI Ergodic Indicator is the same as the True Strength Index (TSI) developed by
William Blau, except the SMI includes a signal line. The SMI uses double moving averages
of price minus previous price over 2 time frames. The signal line, which is an EMA of the
SMI, is plotted to help trigger trading signals. Adjustable guides are also given to fine
tune these signals. The user may change the input (close), method (EMA), period lengths
and guide values.
WARNING:
- For purpose educate only
- This script to change bars colors.
Combo Backtest 123 Reversal & Smart Money Index (SMI) This is combo strategies for get a cumulative signal.
First strategy
This System was created from the Book "How I Tripled My Money In The
Futures Market" by Ulf Jensen, Page 183. This is reverse type of strategies.
The strategy buys at market, if close price is higher than the previous close
during 2 days and the meaning of 9-days Stochastic Slow Oscillator is lower than 50.
The strategy sells at market, if close price is lower than the previous close price
during 2 days and the meaning of 9-days Stochastic Fast Oscillator is higher than 50.
Second strategy
Smart money index (SMI) or smart money flow index is a technical analysis indicator demonstrating investors sentiment.
The index was invented and popularized by money manager Don Hays. The indicator is based on intra-day price patterns.
The main idea is that the majority of traders (emotional, news-driven) overreact at the beginning of the trading day
because of the overnight news and economic data. There is also a lot of buying on market orders and short covering at the opening.
Smart, experienced investors start trading closer to the end of the day having the opportunity to evaluate market performance.
Therefore, the basic strategy is to bet against the morning price trend and bet with the evening price trend. The SMI may be calculated
for many markets and market indices (S&P 500, DJIA, etc.)
The SMI sends no clear signal whether the market is bullish or bearish. There are also no fixed absolute or relative readings signaling
about the trend. Traders need to look at the SMI dynamics relative to that of the market. If, for example, SMI rises sharply when the
market falls, this fact would mean that smart money is buying, and the market is to revert to an uptrend soon. The opposite situation
is also true. A rapidly falling SMI during a bullish market means that smart money is selling and that market is to revert to a downtrend
soon. The SMI is, therefore, a trend-based indicator.
Some analysts use the smart money index to claim that precious metals such as gold will continually maintain value in the future.
WARNING:
- For purpose educate only
- This script to change bars colors.

Combo Backtest 123 Reversal & Stochastic This is combo strategies for get a cumulative signal.
First strategy
This System was created from the Book "How I Tripled My Money In The
Futures Market" by Ulf Jensen, Page 183. This is reverse type of strategies.
The strategy buys at market, if close price is higher than the previous close
during 2 days and the meaning of 9-days Stochastic Slow Oscillator is lower than 50.
The strategy sells at market, if close price is lower than the previous close price
during 2 days and the meaning of 9-days Stochastic Fast Oscillator is higher than 50.
Second strategy
This back testing strategy generates a long trade at the Open of the following
bar when the %K line crosses up UpBand line.
It generates a short trade at the Open of the following bar when the %K line
crosses down DownBand line.
WARNING:
- For purpose educate only
- This script to change bars colors.

Combo Backtest 123 Reversal & RSI HistoAlert This is combo strategies for get a cumulative signal.
First strategy
This System was created from the Book "How I Tripled My Money In The
Futures Market" by Ulf Jensen, Page 183. This is reverse type of strategies.
The strategy buys at market, if close price is higher than the previous close
during 2 days and the meaning of 9-days Stochastic Slow Oscillator is lower than 50.
The strategy sells at market, if close price is lower than the previous close price
during 2 days and the meaning of 9-days Stochastic Fast Oscillator is higher than 50.
Second strategy
This simple indicator modified RSI
WARNING:
- For purpose educate only
- This script to change bars colors.

Combo Backtest 123 Reversal & RSI based on ROC This is combo strategies for get a cumulative signal.
First strategy
This System was created from the Book "How I Tripled My Money In The
Futures Market" by Ulf Jensen, Page 183. This is reverse type of strategies.
The strategy buys at market, if close price is higher than the previous close
during 2 days and the meaning of 9-days Stochastic Slow Oscillator is lower than 50.
The strategy sells at market, if close price is lower than the previous close price
during 2 days and the meaning of 9-days Stochastic Fast Oscillator is higher than 50.
Second strategy
This is the new-age indicator which is version of RSI calculated upon
the Rate-of-change indicator.
The name "Relative Strength Index" is slightly misleading as the RSI
does not compare the relative strength of two securities, but rather
the internal strength of a single security. A more appropriate name
might be "Internal Strength Index." Relative strength charts that compare
two market indices, which are often referred to as Comparative Relative Strength.
And in its turn, the Rate-of-Change ("ROC") indicator displays the difference
between the current price and the price x-time periods ago. The difference can
be displayed in either points or as a percentage. The Momentum indicator displays
the same information, but expresses it as a ratio.
WARNING:
- For purpose educate only
- This script to change bars colors.

Combo Backtest 123 Reversal & Reverse Engineering RSI This is combo strategies for get a cumulative signal.
First strategy
This System was created from the Book "How I Tripled My Money In The
Futures Market" by Ulf Jensen, Page 183. This is reverse type of strategies.
The strategy buys at market, if close price is higher than the previous close
during 2 days and the meaning of 9-days Stochastic Slow Oscillator is lower than 50.
The strategy sells at market, if close price is lower than the previous close price
during 2 days and the meaning of 9-days Stochastic Fast Oscillator is higher than 50.
Second strategy
Reverse Engineering RSI, by Giorgos Siligardos
The related article is copyrighted material from
Stocks & Commodities.
WARNING:
- For purpose educate only
- This script to change bars colors.
Combo Backtest 123 Reversal & Relative Volatility Index This is combo strategies for get a cumulative signal.
First strategy
This System was created from the Book "How I Tripled My Money In The
Futures Market" by Ulf Jensen, Page 183. This is reverse type of strategies.
The strategy buys at market, if close price is higher than the previous close
during 2 days and the meaning of 9-days Stochastic Slow Oscillator is lower than 50.
The strategy sells at market, if close price is lower than the previous close price
during 2 days and the meaning of 9-days Stochastic Fast Oscillator is higher than 50.
Second strategy
The RVI is a modified form of the relative strength index (RSI).
The original RSI calculation separates one-day net changes into
positive closes and negative closes, then smoothes the data and
normalizes the ratio on a scale of zero to 100 as the basis for the
formula. The RVI uses the same basic formula but substitutes the
10-day standard deviation of the closing prices for either the up
close or the down close. The goal is to create an indicator that
measures the general direction of volatility. The volatility is
being measured by the 10-days standard deviation of the closing prices.
WARNING:
- For purpose educate only
- This script to change bars colors.

Combo Backtest 123 Reversal & Relative Momentum Index This is combo strategies for get a cumulative signal.
First strategy
This System was created from the Book "How I Tripled My Money In The
Futures Market" by Ulf Jensen, Page 183. This is reverse type of strategies.
The strategy buys at market, if close price is higher than the previous close
during 2 days and the meaning of 9-days Stochastic Slow Oscillator is lower than 50.
The strategy sells at market, if close price is lower than the previous close price
during 2 days and the meaning of 9-days Stochastic Fast Oscillator is higher than 50.
Second strategy
The Relative Momentum Index (RMI) was developed by Roger Altman. Impressed
with the Relative Strength Index's sensitivity to the number of look-back
periods, yet frustrated with it's inconsistent oscillation between defined
overbought and oversold levels, Mr. Altman added a momentum component to the RSI.
As mentioned, the RMI is a variation of the RSI indicator. Instead of counting
up and down days from close to close as the RSI does, the RMI counts up and down
days from the close relative to the close x-days ago where x is not necessarily
1 as required by the RSI). So as the name of the indicator reflects, "momentum" is
substituted for "strength".
WARNING:
- For purpose educate only
- This script to change bars colors.

Combo Backtest 123 Reversal & Recursive Moving Trend Average This is combo strategies for get a cumulative signal.
First strategy
This System was created from the Book "How I Tripled My Money In The
Futures Market" by Ulf Jensen, Page 183. This is reverse type of strategies.
The strategy buys at market, if close price is higher than the previous close
during 2 days and the meaning of 9-days Stochastic Slow Oscillator is lower than 50.
The strategy sells at market, if close price is lower than the previous close price
during 2 days and the meaning of 9-days Stochastic Fast Oscillator is higher than 50.
Second strategy
Taken from an article "The Yen Recused" in the December 1998 issue of TASC,
written by Dennis Meyers. He describes the Recursive MA in mathematical terms
as "recursive polynomial fit, a technique that uses a small number of past values
of the estimated price and today's price to predict tomorrows price."
Red bars color - short position. Green is long.
WARNING:
- For purpose educate only
- This script to change bars colors.

Combo Backtest 123 Reversal & RAVI This is combo strategies for get a cumulative signal.
First strategy
This System was created from the Book "How I Tripled My Money In The
Futures Market" by Ulf Jensen, Page 183. This is reverse type of strategies.
The strategy buys at market, if close price is higher than the previous close
during 2 days and the meaning of 9-days Stochastic Slow Oscillator is lower than 50.
The strategy sells at market, if close price is lower than the previous close price
during 2 days and the meaning of 9-days Stochastic Fast Oscillator is higher than 50.
Second strategy
The indicator represents the relative convergence/divergence of the moving
averages of the financial asset, increased a hundred times. It is based on
a different principle than the ADX. Chande suggests a 13-week SMA as the
basis for the indicator. It represents the quarterly (3 months = 65 working days)
sentiments of the market participants concerning prices. The short moving average
comprises 10% of the one and is rounded to seven.
WARNING:
- For purpose educate only
- This script to change bars colors.
Combo Backtest 123 Reversal & Rainbow Oscillator This is combo strategies for get a cumulative signal.
First strategy
This System was created from the Book "How I Tripled My Money In The
Futures Market" by Ulf Jensen, Page 183. This is reverse type of strategies.
The strategy buys at market, if close price is higher than the previous close
during 2 days and the meaning of 9-days Stochastic Slow Oscillator is lower than 50.
The strategy sells at market, if close price is lower than the previous close price
during 2 days and the meaning of 9-days Stochastic Fast Oscillator is higher than 50.
Second strategy
Ever since the people concluded that stock market price movements are not
random or chaotic, but follow specific trends that can be forecasted, they
tried to develop different tools or procedures that could help them identify
those trends. And one of those financial indicators is the Rainbow Oscillator
Indicator. The Rainbow Oscillator Indicator is relatively new, originally
introduced in 1997, and it is used to forecast the changes of trend direction.
As market prices go up and down, the oscillator appears as a direction of the
trend, but also as the safety of the market and the depth of that trend. As
the rainbow grows in width, the current trend gives signs of continuity, and
if the value of the oscillator goes beyond 80, the market becomes more and more
unstable, being prone to a sudden reversal. When prices move towards the rainbow
and the oscillator becomes more and more flat, the market tends to remain more
stable and the bandwidth decreases. Still, if the oscillator value goes below 20,
the market is again, prone to sudden reversals. The safest bandwidth value where
the market is stable is between 20 and 80, in the Rainbow Oscillator indicator value.
The depth a certain price has on a chart and into the rainbow can be used to judge
the strength of the move.
WARNING:
- For purpose educate only
- This script to change bars colors.
Combo Backtest 123 Reversal & Qstick Indicator This is combo strategies for get a cumulative signal.
First strategy
This System was created from the Book "How I Tripled My Money In The
Futures Market" by Ulf Jensen, Page 183. This is reverse type of strategies.
The strategy buys at market, if close price is higher than the previous close
during 2 days and the meaning of 9-days Stochastic Slow Oscillator is lower than 50.
The strategy sells at market, if close price is lower than the previous close price
during 2 days and the meaning of 9-days Stochastic Fast Oscillator is higher than 50.
Second strategy
A technical indicator developed by Tushar Chande to numerically identify
trends in candlestick charting. It is calculated by taking an 'n' period
moving average of the difference between the open and closing prices. A
Qstick value greater than zero means that the majority of the last 'n' days
have been up, indicating that buying pressure has been increasing.
Transaction signals come from when the Qstick indicator crosses through the
zero line. Crossing above zero is used as the entry signal because it is indicating
that buying pressure is increasing, while sell signals come from the indicator
crossing down through zero. In addition, an 'n' period moving average of the Qstick
values can be drawn to act as a signal line. Transaction signals are then generated
when the Qstick value crosses through the trigger line.
WARNING:
- For purpose educate only
- This script to change bars colors.